
You can use your browser Developer Tools (DevTools) to see which domains contain scripts and other resources requested by a website.
1. Open developer tools
On most browsers, you can press Ctrl + Shift + I or F12.
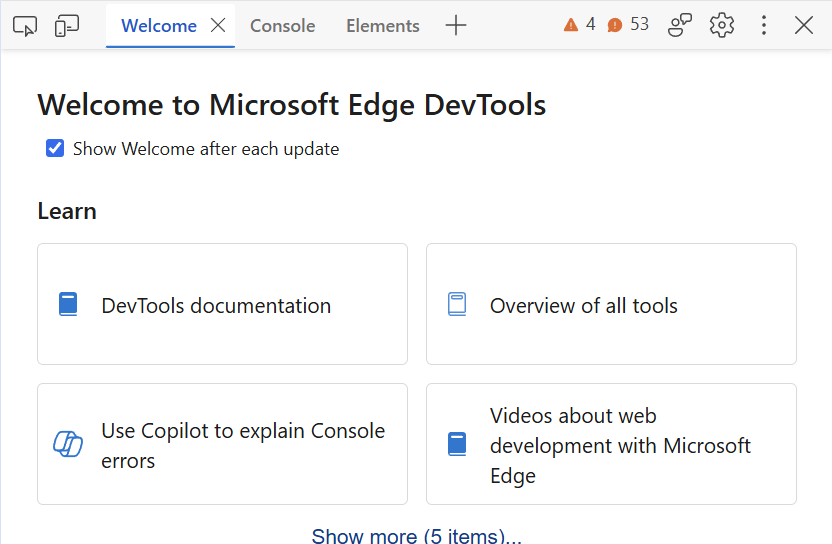
You may see a welcome screen if you’re opening DevTools for the first time.
2. Go to the Network tab
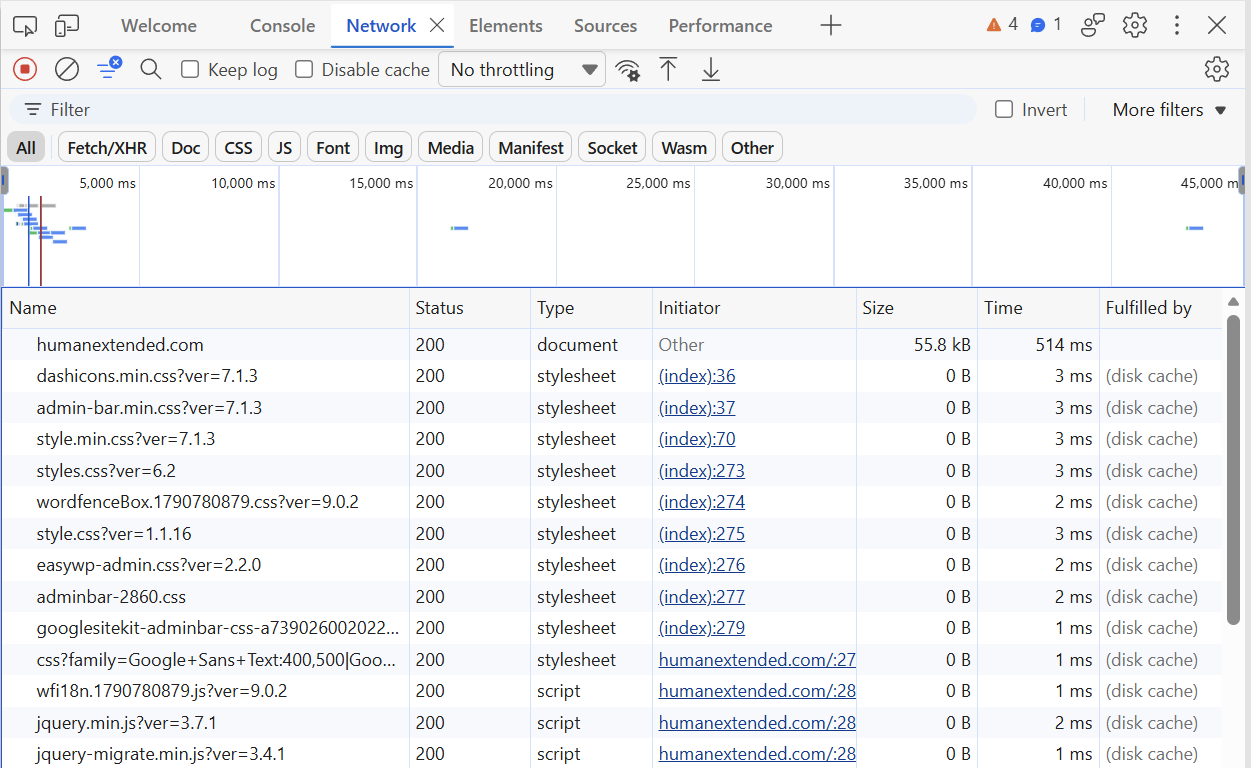
Click the Network tab located at the top of the DevTools panel.
If you don’t see a Network tab, add it:
- Click the big + button located to the right of the tabs
- Select Network
3. Refresh the page
The Network tab must be open to record network requests. Refresh the page to see all of the requests made to any host such as your web server, Google, Square, etc.
4. Scroll down to trigger deferred requests
Scroll to the bottom of the page.
Scrolling is needed because network requests are often deferred until content comes into view. For example, there are popular widgets for embedding maps, reviews, etc. These widgets are usually designed to defer loading until actually needed.
5. Show the Domain column
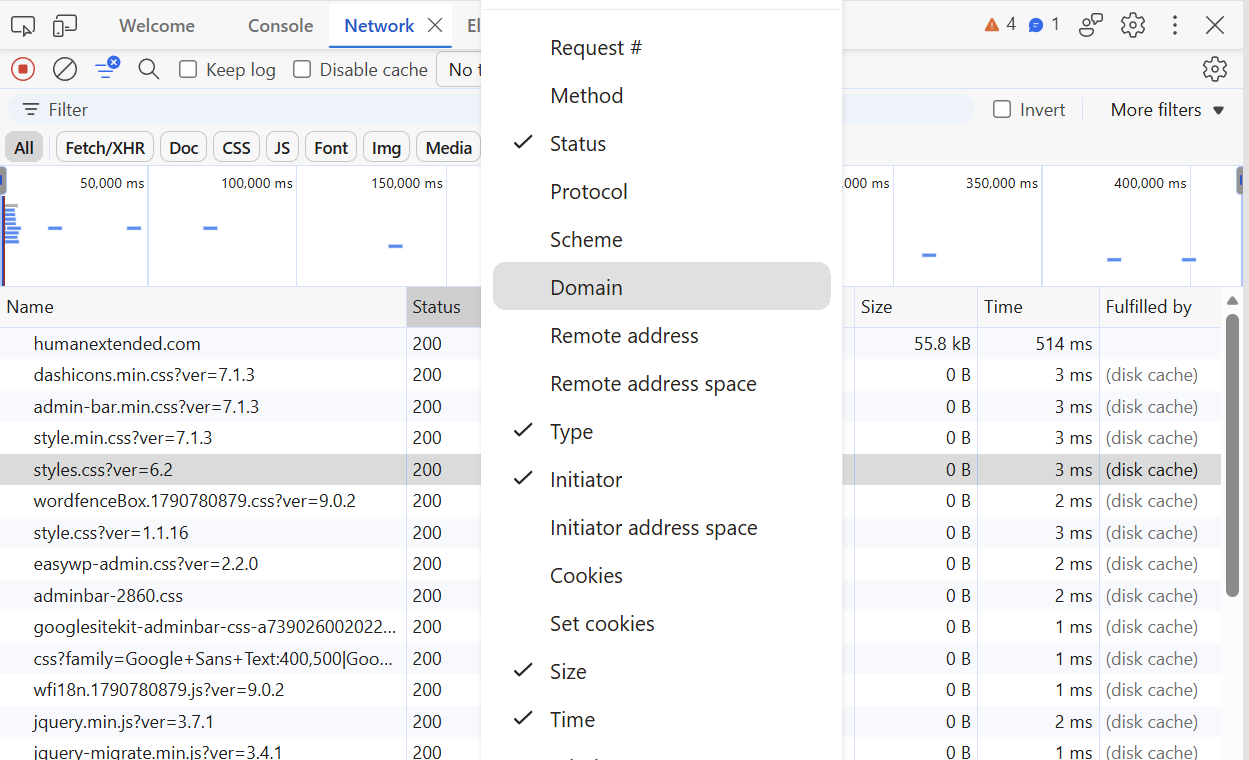
Look for the Domain column in the table. If you don’t see it, right-click anywhere in the table header and select Domain. After it appears, you may need to resize the panel or hide other columns to ensure you can see the entire column.
6. Sort by the domain column
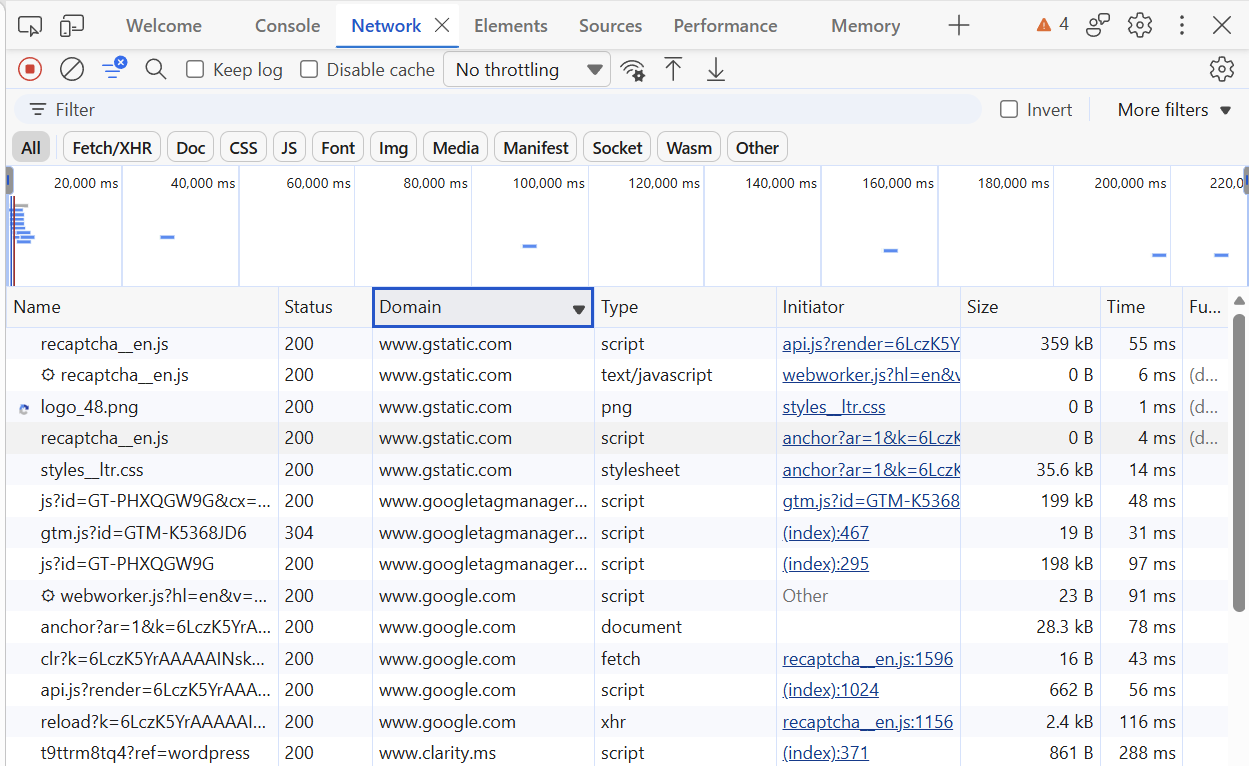
Click the header of the Domain column to sort the rows. All requests to the same domain will be sorted together, making it easier for you to identify distinct domains.
Lastly, explore and have fun
Click on any row to view more information about that particular network request.
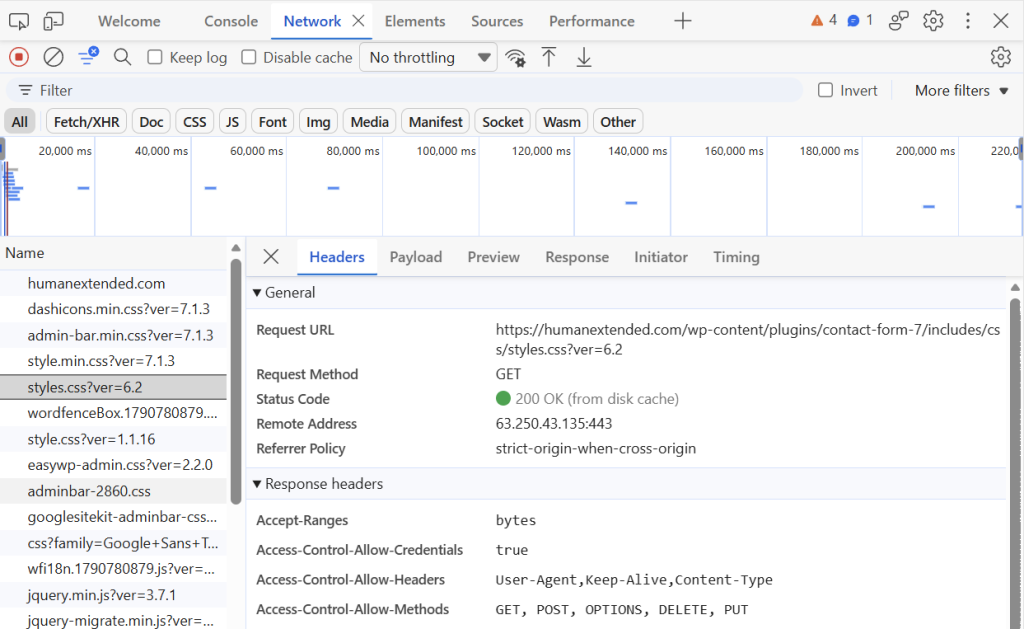
To close the details panel, click the big X button located in its upper-left corner.

 You are free to share and adapt this content for any purpose as long as you give appropriate credit in a reasonable manner.
Leave a Reply